 Carlos D. Prado S.
MSc capstone · Data visualization
Energy transition analytics
A global energy-data project combining relational modelling, Tableau storytelling, and Python forecasting to examine supply, demand, and renewable potential.
- Role
- Data sourcing, database design, analysis, forecasting, and dashboard design
- Period
- 2022
- Status
- Academic capstone
Challenge
What the work needed to resolve.
Unify heterogeneous global energy, population, development, and weather sources into a navigable story about the transition to 2050.
Approach
A system designed for scrutiny.
- 01
Built master tables and a relational model from international energy and development sources.
- 02
Designed Tableau dashboards for energy mix, renewable potential, investment context, and dependence risks.
- 03
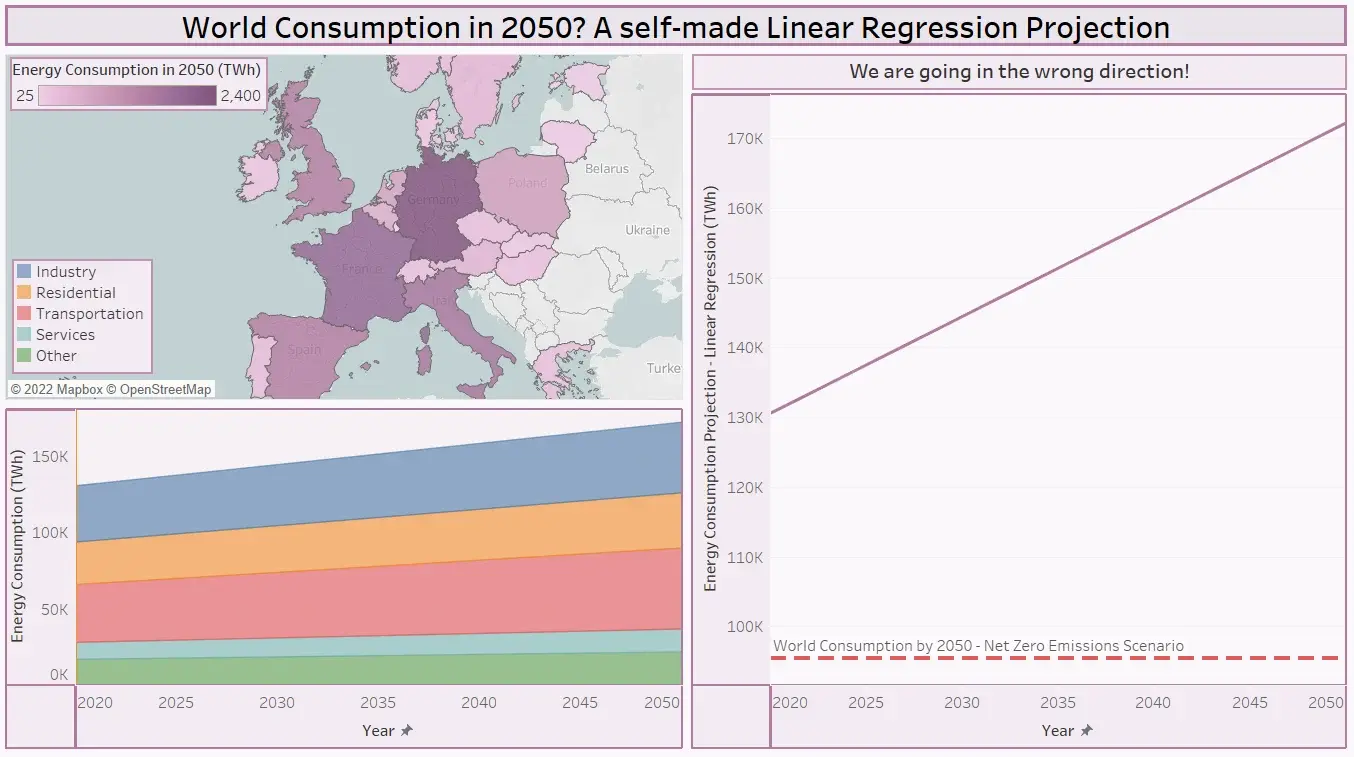
Compared linear-regression and LSTM projection workflows in Python notebooks.
Inside
What the system actually produces.
The figures below are rebuilt in the portfolio from synthetic series, so they show the shape of each output without carrying any real data out of the project.
The transition question is a composition question: what share each source holds, and how fast the shares move.
A projection is only honest with its band attached. The further past the observed window, the wider the interval it has to carry.
Outcome